Statistics & Performance charts, analyse your monitoring logs
We are continuing with our rapid development and last week new version was published (1.4.2).
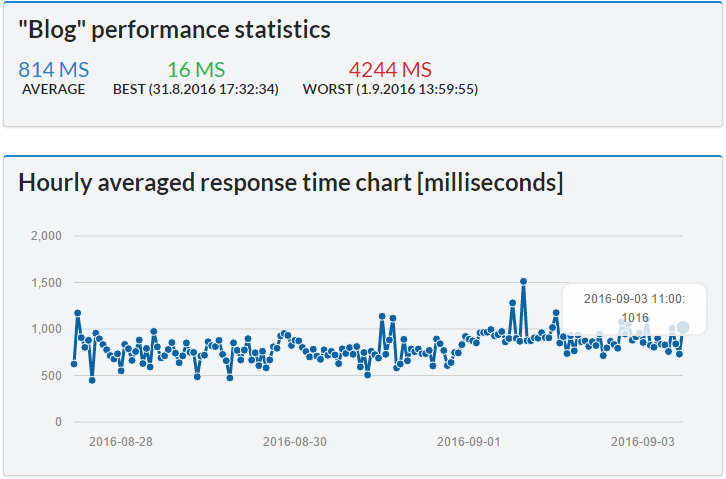
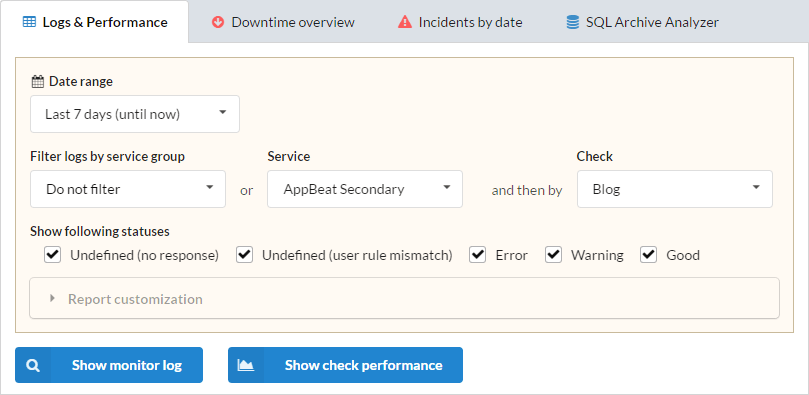
In this version we introduced new powerful report - Logs & Performance, and published final version of downtime report. Here are some screenshots of new features.
Performance statistics & hourly averaged response time chart for your periodic check:

Filtering monitoring logs:

As you may noticed, we now also allow you to filter logs and calculate downtime reports by “service group”. Service groups are optional groups useful especially for larger organizations. It allows you to group any combination of your services into its own group. Those groups can then be used to assign email/SMS contacts for error notifications (contacts can be members of service groups), or they can be used for filtering data in reports.
List of all changes in version 1.4.2:
- improved “Downtime overview” report (added downtime tooltips to timeline, added aggregated check report in service details). It is now out of beta.
- new added “Reports / Logs & Performance” module for more powerful log analysis (you can drill down your data to lowest check level)
- removed removed “Reports / Statistics & Logs” (replaced by new, more powerful reports)
- update simplified “Live status” tiles & optimizations
- update other minor improvements
We are already working on some new useful features for next version! Stay tuned…